Skip to content Skip to footer

PRECISION ILLUSTRATION FOR RESEARCH & PUBLICATION

2D Vector Graphic Software for Scientific Illustration

YOU DON’T COMPROMISE.
neither do we.
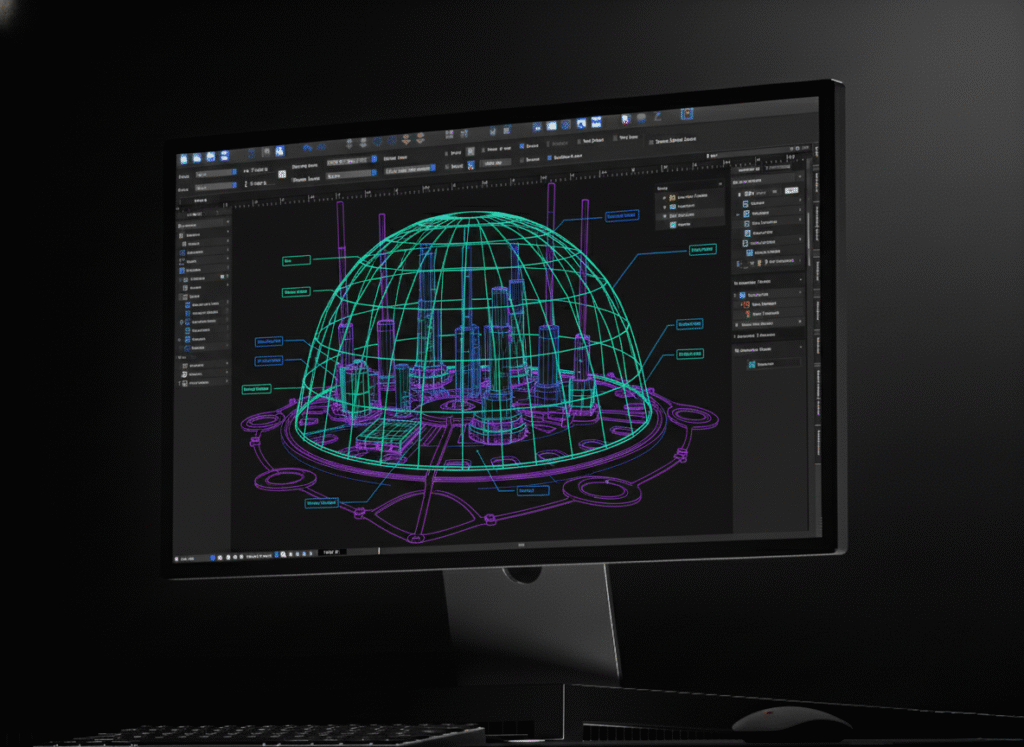
technical illustration software
A figure that misleads is worse than no figure at all.

OUR HERO

Scientific Illustrator

Data-Accurate, Not Just Good-Looking.

canvasxdraw's drawing engine fully conforms to the IEEE floating point standard used across scientific, engineering, medical, and biotechnology fields. Position objects from geometric data and adjust coordinates numerically. Your figure represents what the data actually says.

Microscopy to Vector, Instantly.

Bridge the raster/vector gap with Auto Trace: turn a microscopy image, scan, or photograph into clean, editable vector line art. Layer that vector work directly over the source imagery in the same document.

Publication-Ready, Every Format.

Full color management from RGB to CMYK, resolution-independent vector output, and export controls built for journal submission requirements so the same figure holds up on screen, in print, and at poster size.

WHAT IS CANVASXDRAW?

Scientific Illustration & Figures Software for Research Teams

canvasxdraw is scientific illustration software built for the researchers, science communicators, and technical illustrators who turn raw data and reference imagery into accurate, publication-ready scientific figures. It combines vector precision with full raster image editing in one workspace, built to the numerical accuracy standards research and biotech work demands.

technical illustration software
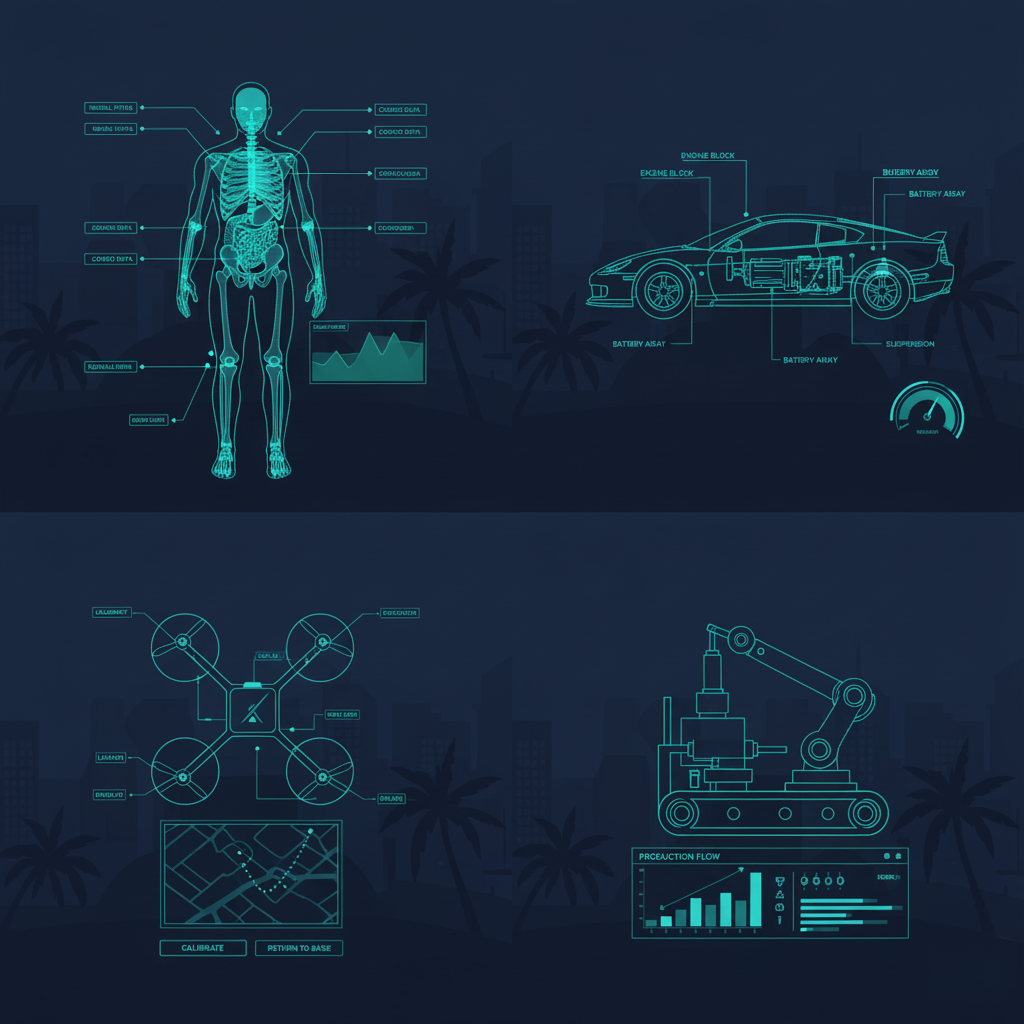
Technical Drawing Software

HOW DO I USE CANVASXDRAW?

From Raw Data to Publication Figure

Import microscopy images, scans, or reference photography, and combine them with precise vector diagrams in a single document. Use Auto Trace to convert raster reference material into clean, editable line art. Create illustrations directly from geometric data, and adjust object coordinates numerically for absolute precision. Build a Symbol Library of recurring diagram elements like lab equipment, anatomical structures, molecular components and reuse them consistently across every figure. Present data visually with built-in flowchart and chart tools, without importing static charts from a separate spreadsheet program.

WHY SHOULD I USE CANVASXDRAW?

Because Peer Review Doesn't Forgive Sloppy Figures

Scientific illustration carries a different bar than general graphic design: figures need to be numerically accurate, reproducible, and clear enough to survive scrutiny from reviewers who know the subject better than most audiences ever will. canvasxdraw gives you IEEE-conformant precision, a hybrid vector/raster workspace, and export controls built for publication, not a general-purpose design tool adapted after the fact.

Engineering Drawing Software

Don't Compromise

Click down arrow for more details

Painless Precision

Work with infinitesimal units of measure with certainty and control. canvasxdraw’s drawing engine fully conforms to the IEEE floating point standard used in scientific, engineering, medical, and biotechnology industries.

Autotrace Your Trace

Bridge the raster/vector gap instantly. Convert a microscopy image, scan, or reference photo into clean, editable vector line art with the Auto Trace command.

Drawing with Data

Create illustrations from geometric data, use grids and guides to position objects, and adjust objects’ numerical position for absolute precision.

Go With The Flow(Chart)

Present complex data in visually appealing, logical, and accessible flowcharts and tables, without importing static pre-made charts from an external spreadsheet program.

Add Objects on the Fly

Build a Symbol Library of recurring diagram elements. Update one instance, and every copy across your figures updates automatically.

Scientific Applications

Journal & Publication Figures

Build figures that survive peer review: numerically accurate, reproducible, and formatted to the resolution and color-mode requirements your target journal actually asks for.

Microscopy & Imaging Illustrations

Bridge the gap between a raw microscopy image and a publication-ready figure. Auto Trace converts scans and photographs into clean vector line art you can layer directly over the source imagery.

Molecular & Biological Diagrams

Build recurring diagram elements like lab equipment, anatomical structures, molecular components into a reusable Symbol Library, and keep every figure in a series visually consistent.

Research Presentation Graphics

Turn raw data into flowcharts, schematics, and presentation visuals without importing static charts from a separate spreadsheet program, built directly into the same document as your figures.

Grant & Manuscript Documentation

Produce the consistent, accurate figures that support grant applications and manuscript submissions which are reusable across drafts, revisions, and resubmissions without starting over.

Who Uses canvasxdraw for Scientific Illustration?

Scientific illustrators, researchers, and science communicators, as well as academic documentation teams. Biotech and pharmaceutical R&D teams, university labs, medical illustrators, and journal authors — anyone turning raw data into a figure that must survive peer review.

Precision Scientific Illustration vs. General-Purpose Design Software

Requirement

Canvasxdraw

General-purpose design software
IEEE floating-point numerical accuracy

Yes

Not a standard spec

Vector + raster in one document

Yes

Varies by tool

Auto Trace (raster reference to clean vector)

Yes

Rare or manual

RGB to CMYK color management

Yes

Varies by tool

Export controls built for journal submission

Yes

Varies by tool

Reusable symbol library for diagram elements

Yes

Varies by tool

FAQ(Frequently Asked Questions)

canvasxdraw gives you the precision vector tools, color management (RGB/CMYK), and high-resolution export controls to produce figures that meet common journal formatting standards. Specific submission requirements vary by publication, so always confirm format and resolution specs with your target journal before final export.

Yes. canvasxdraw is precision 2D scientific illustration software built for researchers, science communicators, and technical illustrators who need figures that are numerically accurate, not just visually clean and conformant to the IEEE floating point standard used across scientific and biotechnology fields.

Scientific figures typically require a tool that combines vector precision with raster image editing, so researchers can layer microscopy or reference imagery under accurate vector diagrams. canvasxdraw is built specifically for that role, with export controls suited to journal submission.

Yes. canvasxdraw is a vector-based illustration tool at its core, combined with full raster image editing in the same document.

Yes. Build recurring diagram elements like molecular structures, anatomical components, lab equipment into a reusable Symbol Library, and create illustrations directly from geometric data for absolute positional accuracy.

Yes. canvasxdraw provides full color management from RGB to CMYK, so the same figure holds up correctly on screen, in print, and in journal production.

canvasxdraw is available for Windows (7, 8, 8.1, and 10, 64-bit) and macOS, including native Universal support for Apple Silicon.

FIND YOUR FIT

Pricing Plans

subscribe

buy

Most Popular


All in one graphics software universal for macOS

1 Year Term

Most Popular


Visualize complex ideas with precision and clarity

1 Year Term

Most Popular


Combining a rich graphic toolset with sophisticated geospatial data handling

1 Year Term

Most Popular


All in one graphics software, universal for macOS

perpetual license

Most Popular


Visualize complex ideas with precision and clarity

perpetual license

Most Popular


Combining a rich graphic toolset with sophisticated geospatial data handling

3 Year Term

Offline (air-gapped) licensing available contact sales@vectorgfx.net

View System requirements for Mac or Windows here